
Mixpanel vs. Amplitude vs. Heap vs. Statsig: How to Choose a Product Analytics Platform
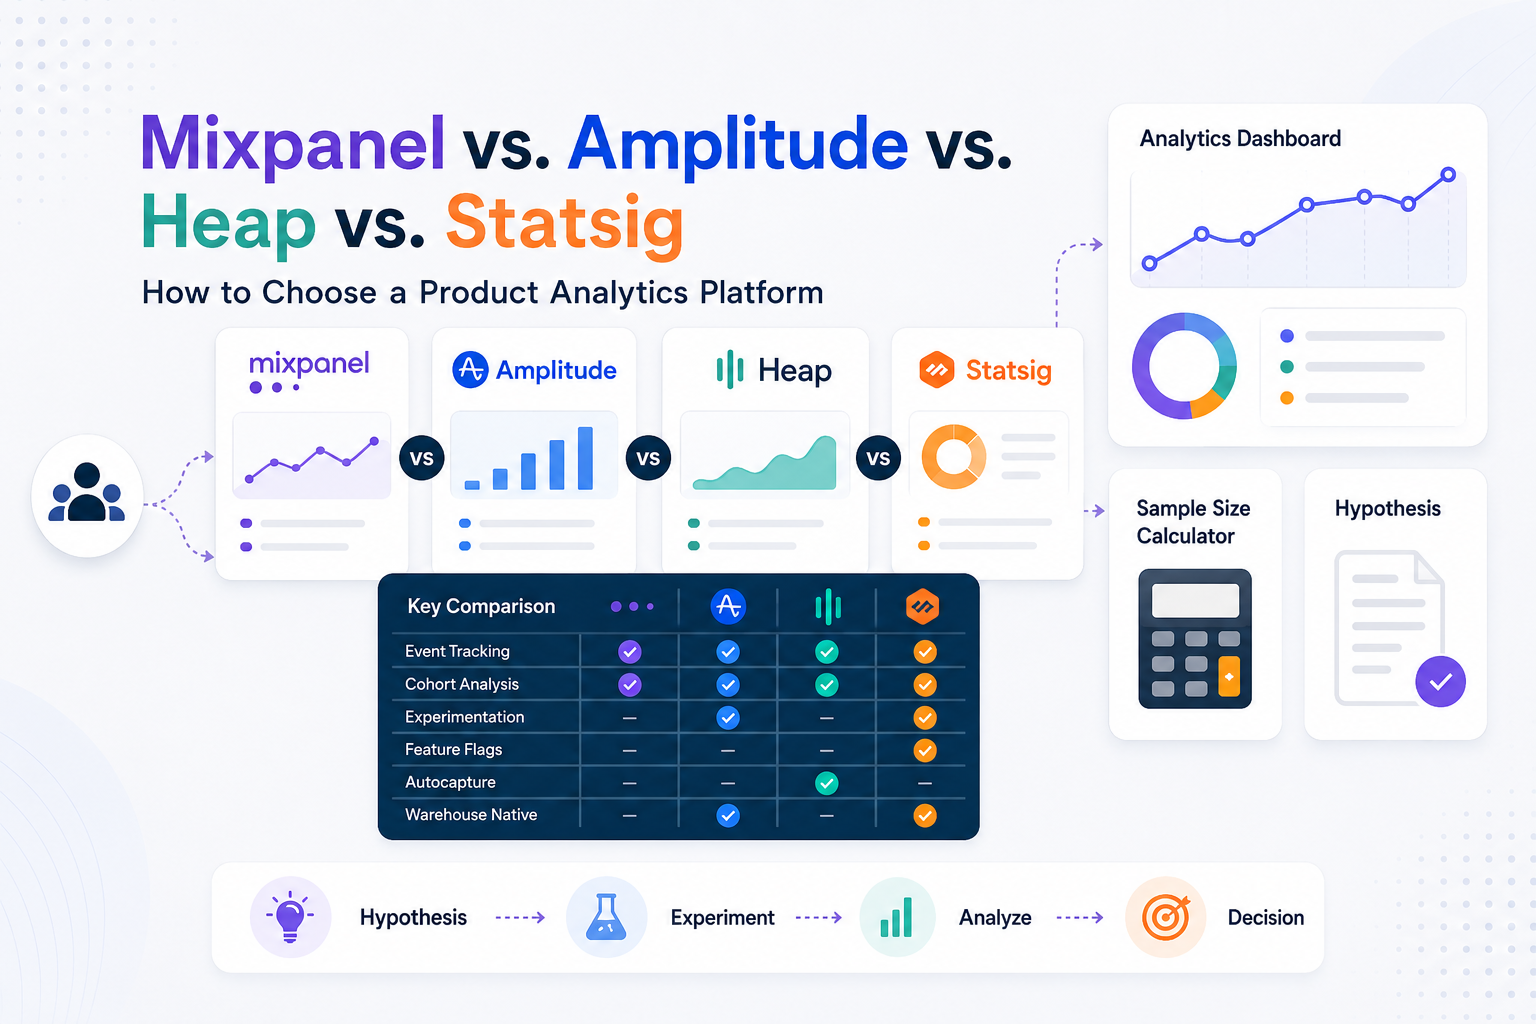
A practical comparison for teams choosing (or switching) their product analytics stack.
The problem: most teams pick a product analytics tool for the wrong reasons
Most product analytics platform decisions get made in a demo call. A sales engineer shows a slick dashboard, the team gets excited about a feature they will use twice, and six months later the implementation is half-finished, the event taxonomy is inconsistent, and nobody trusts the retention numbers.
The tools themselves are rarely the problem. Mixpanel, Amplitude, Heap, and Statsig are all mature platforms used by thousands of companies. The problem is that they are built around different assumptions about how your team tracks data, how much engineering time you can commit, and what question you are actually trying to answer. Picking the wrong one for your situation means paying for capability you never use, or hitting a wall the tool was never designed to solve.
This guide breaks down what each platform actually does well, where they fall short, and how to run an evaluation that gets you to the right answer instead of the most popular one.
Why the “best” platform is the wrong question
Vendor comparison articles tend to score platforms on feature checklists, which is a poor proxy for fit. A feature-flag-heavy engineering team and a marketing-led growth team asking “which of these events converts” need fundamentally different tools, even though both are technically “product analytics.” The more useful question is not which platform has the most features, but which platform matches how your team already works: how much engineering time you can dedicate to instrumentation, how technical the people building reports actually are, and whether experimentation needs to live inside the same tool as your usage data.
What “product analytics” software is actually doing
Underneath the dashboards, every platform in this category does the same three things: it captures user and account-level events, it stores them in a queryable event schema, and it gives your team a way to build funnels, retention curves, and cohorts on top of that data without writing SQL. The differences show up in how events get captured, how the platforms handle scale and pricing, and how much analysis you can do without engineering support.
A closer look at each platform
Mixpanel
Mixpanel remains the default choice for growth and marketing-adjacent product teams that want fast, self-serve cohort building without heavy engineering involvement. Its strength is speed: once events are instrumented, non-technical team members can build funnels and retention reports without SQL. The tradeoff is that Mixpanel rewards discipline. Without a maintained tracking plan, event names multiply, definitions drift between teams, and the same “self-serve” reporting that made the tool attractive becomes a source of conflicting numbers.
Amplitude
Amplitude covers the same core ground as Mixpanel but goes further into predictive analytics, behavioral cohorts, and native experimentation. It is a common choice for mid-market and enterprise product teams that need to connect product usage to revenue outcomes, and its warehouse-native option makes it a strong fit for teams that already run a modern data stack on BigQuery or Snowflake. The tradeoff is cost: Amplitude’s pricing is based on monthly tracked users, and costs can climb quickly as a product scales without careful event volume management.
Heap
Heap’s defining feature is autocapture: instead of manually instrumenting every event before you can analyze it, Heap captures UI interactions automatically and lets you define events retroactively. This is genuinely useful for lean teams without dedicated engineering support, or for teams that do not yet know which events matter. The cost shows up later, autocaptured data is noisy, and turning it into a clean, reliable reporting layer takes real cleanup work that many teams underestimate.
Statsig
Statsig is built by former large-scale infrastructure engineers and treats experimentation as a first-class citizen rather than an add-on. For engineering-led product teams that want feature flagging, A/B testing, and product analytics in a single platform with shared data, Statsig removes the integration gap that shows up when analytics and experimentation live in separate tools. It asks more of the team up front, the interface and mental model are built for engineers first, product managers second, which can slow adoption on less technical teams.
Mixpanel, Amplitude, Heap, and Statsig side by side
| Dimension | Mixpanel | Amplitude | Heap | Statsig |
|---|---|---|---|---|
| Core data model | Manually defined events, strong on user/behavioral cohorts | Manually defined events, strong on behavioral cohorts + predictive analytics | Autocapture of UI interactions, events defined retroactively | Events + built-in experimentation as first-class citizens |
| Setup effort | Moderate, needs a tracking plan | Moderate to high, tracking plan plus taxonomy governance | Low to start, higher later to clean up noisy autocaptured data | Moderate, SDK-based, built for engineering-led teams |
| Experimentation / feature flags | Add-on, limited | Native experimentation module | Not native | Native and central to the product |
| Warehouse-native option | Reverse ETL / warehouse connectors available | Strong warehouse-native (Amplitude Data) | Limited | Warehouse-native via Statsig Warehouse Native |
| Best fit | Growth and marketing teams needing fast, self-serve cohorting | Mid-market to enterprise product teams wanting deep behavioral + predictive analysis | Teams that want data first, taxonomy later, or lean analytics teams without engineering bandwidth | Engineering-led product teams that want analytics and experimentation in one tool |
| Common pitfall | Event sprawl without governance makes reports unreliable | Cost scales fast with MTUs; requires disciplined event volume management | Autocapture creates noisy, hard-to-query data without cleanup | Steeper learning curve for non-technical stakeholders |
Signs you have the wrong product analytics tool
- Your team builds the same funnel or retention report manually every week because the tool cannot answer the question directly.
- Engineers spend more time maintaining tracking than product managers spend using the data.
- Two people pull the same metric and get two different numbers.
- You are paying for enterprise-tier pricing but only using basic funnel and retention views.
- Experimentation lives in a separate tool that does not share event data with your analytics platform.
- New team members cannot self-serve an answer without asking a data analyst to run a query.
How to evaluate a product analytics platform
Run the evaluation against your actual use case, not the vendor’s use case. A structured checklist keeps the decision grounded:
- Define the three to five questions your team needs to answer weekly (activation rate, feature adoption, retention by cohort, and so on) and test each platform against those questions specifically, not a generic demo.
- Map your engineering bandwidth honestly. Autocapture tools reduce upfront engineering work but increase later cleanup; manually-instrumented tools require upfront discipline but produce cleaner data long-term.
- Price out the tool at your actual event or user volume 12 months out, not today’s volume. Pricing models diverge sharply at scale.
- Check whether experimentation and feature flagging need to live in the same platform as your analytics, or whether a separate tool with a clean data connection is acceptable.
- Confirm the platform supports your existing data stack, warehouse sync, CDP integration, and the destinations your marketing and revenue teams already depend on.
- Pilot with a single team or product area before a company-wide rollout. Migration and re-instrumentation are the most expensive part of getting this decision wrong.
The hidden cost most teams miss: migration and cleanup
List pricing is the easiest number to compare and the least representative of total cost. The real cost driver in almost every product analytics decision is the work required to get from your current tracking state to a clean, trustworthy event schema in the new tool. Teams moving off Mixpanel or Amplitude usually carry years of inconsistent event names and duplicate properties into the new platform unless someone deliberately re-architects the tracking plan during the switch. Teams adopting Heap for the first time often discover that autocaptured events, while easy to turn on, require weeks of naming and filtering work before dashboards are reliable enough for leadership reporting. Budget for this work explicitly rather than treating it as a rounding error on the subscription cost.
When it makes sense to bring in outside help
Most platform migrations and comparative evaluations go sideways not because of the tool, but because of the tracking plan underneath it. An independent analytics consultancy that has implemented all four platforms can run a vendor-neutral evaluation against your specific data volume and use cases, and can migrate your existing event taxonomy without the gaps and duplicate events that come from a rushed switch. That independence matters: a vendor’s sales team is never going to tell you their platform is the wrong fit.
Frequently asked questions
1. Can we run more than one product analytics tool at the same time?
Technically yes, but it creates the exact problem this guide is trying to solve: two sources of truth. Most teams that run parallel tools do it temporarily during a migration, then consolidate to one platform of record within a few months.
2. Which platform is cheapest for an early-stage startup?
Heap and Statsig both offer usable free tiers for small event volumes. Cost is rarely the deciding factor at this stage, implementation speed and how quickly the team can self-serve insights usually matter more.
3. Do we need a data engineer to implement any of these tools?
Not strictly, but a clean event taxonomy and consistent naming conventions make the difference between a tool that gets used and one that gets abandoned after three months. That work benefits from analytics expertise even when the underlying SDK integration is simple.
4. How long does a migration between platforms typically take?
A straightforward migration with a well-documented existing tracking plan takes two to four weeks. Migrations involving cleanup of an undocumented or inconsistent event schema typically take six to ten weeks.
5. Does switching platforms mean losing historical data?
Historical data can usually be exported and warehoused, but it will not be queryable inside the new platform’s native interface unless it is backfilled or re-imported, which most platforms support with limitations on volume and format.
Get a second opinion before you commit
Kaliper has implemented and migrated teams across Mixpanel, Amplitude, Heap, and Statsig, and audits tracking plans for a living. If you are evaluating a switch or trying to fix an analytics setup that nobody trusts, we can run a vendor-neutral assessment against your actual data and use cases.
Book a free product analytics audit: https://calendly.com/kaliper_expert/discovery-call?utm_source=blog&utm_medium=cta&utm_campaign=product_analytics_platform_comparison
Working through this in your own stack?
We do this for a living. Bring one dashboard you don't trust and we'll tell you why the number is wrong.